
Live data
Synthetic scans measure your website under controlled conditions. Live data shows what your real visitors experience — on their devices, with their connection, in their region.
The difference
Synthetic vs. real
Synthetic scan
turbometrics launches a real browser in a data centre and measures your page under defined conditions. Reproducible, comparable, independent of current traffic.
Live data (RUM)
A lightweight script measures directly in your visitors' browsers. You see what actually happens — on old smartphones, with a poor 3G connection, from any region.
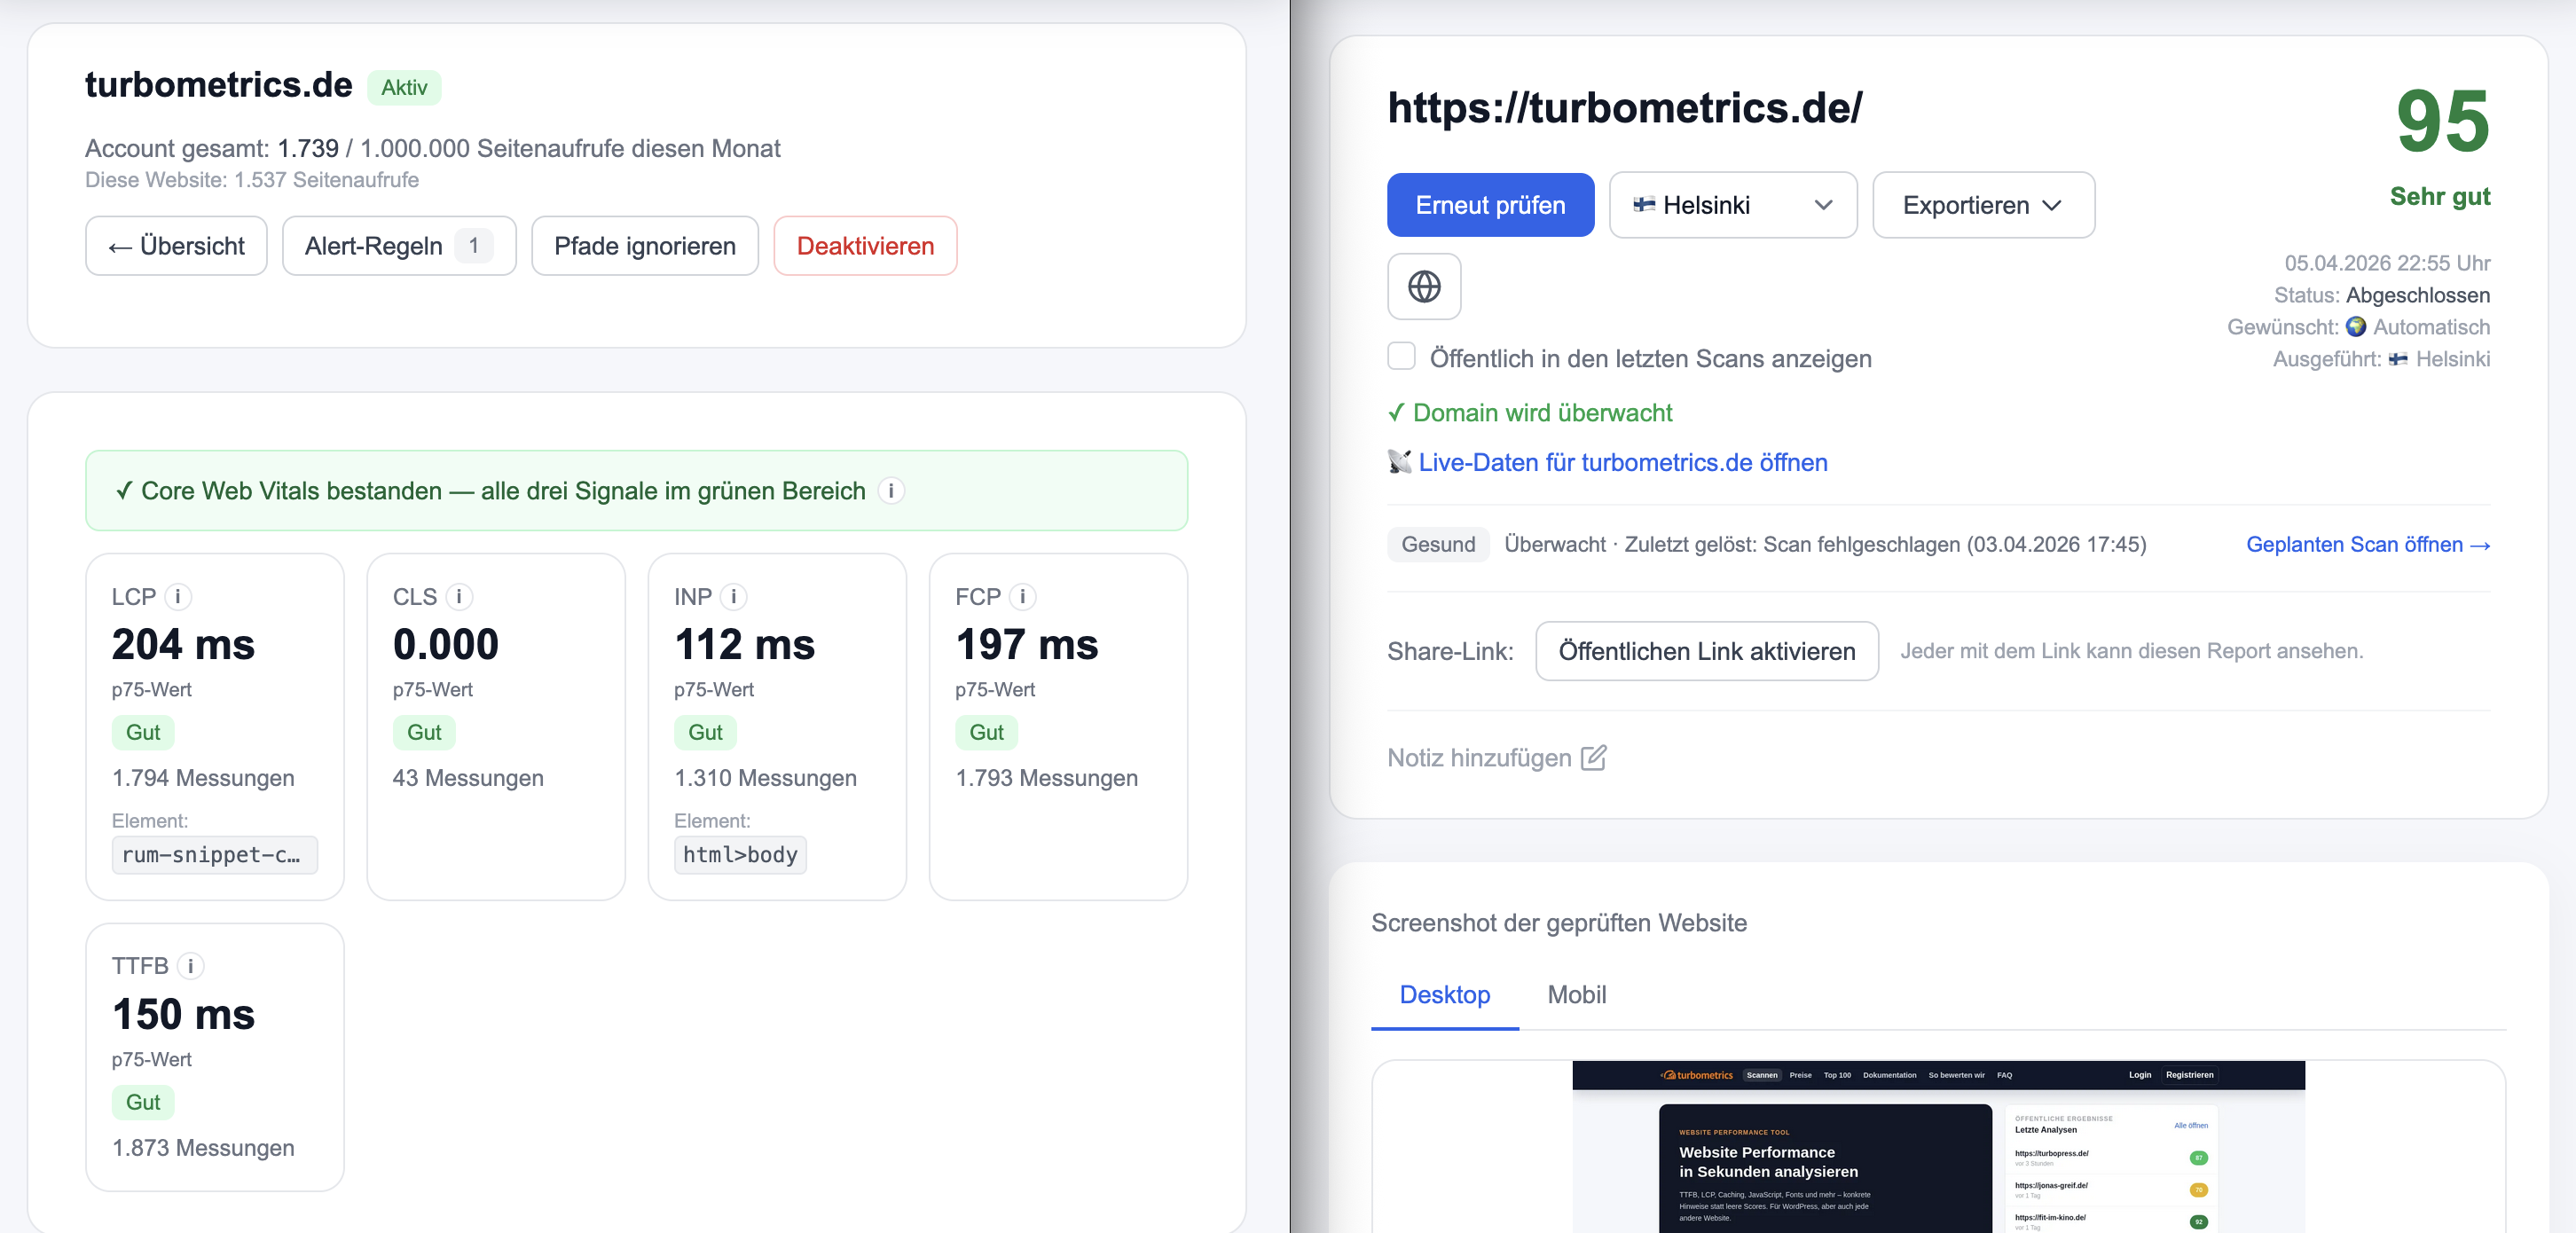
Left: live data with real visitor measurements. Right: synthetic scan report.
Three steps
How the measurement works
A single script tag in the <head> of your website is enough. An official plugin is available for WordPress.
The script measures LCP, CLS, INP, FCP and TTFB directly in each visitor's browser — without cookies, without personal data, GDPR compliant.
All measurements land in your turbometrics dashboard. p75 values, history, device, country, connection quality — all at a glance.
Analysis
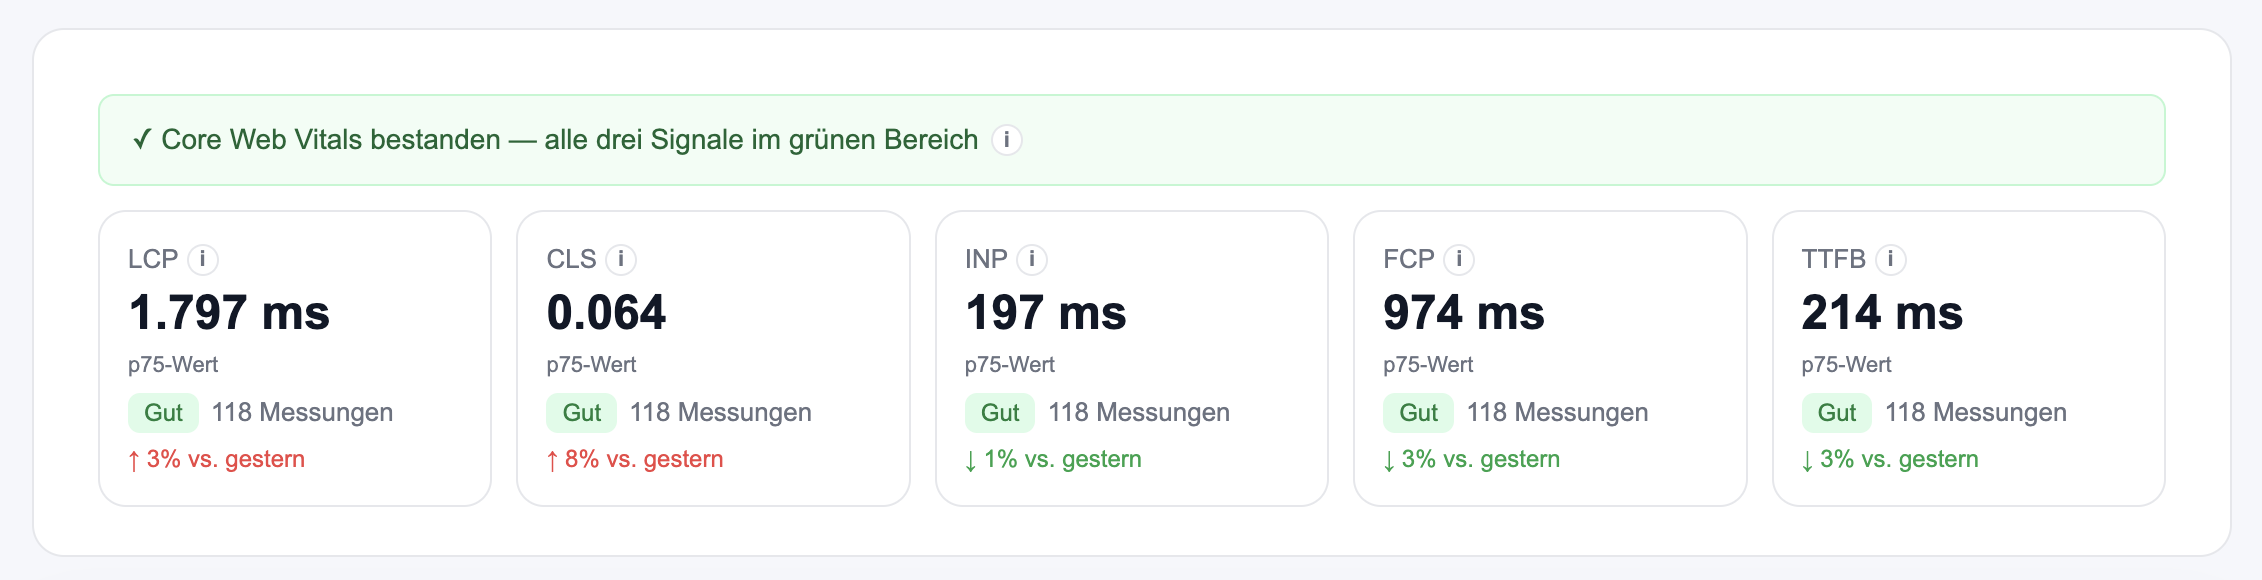
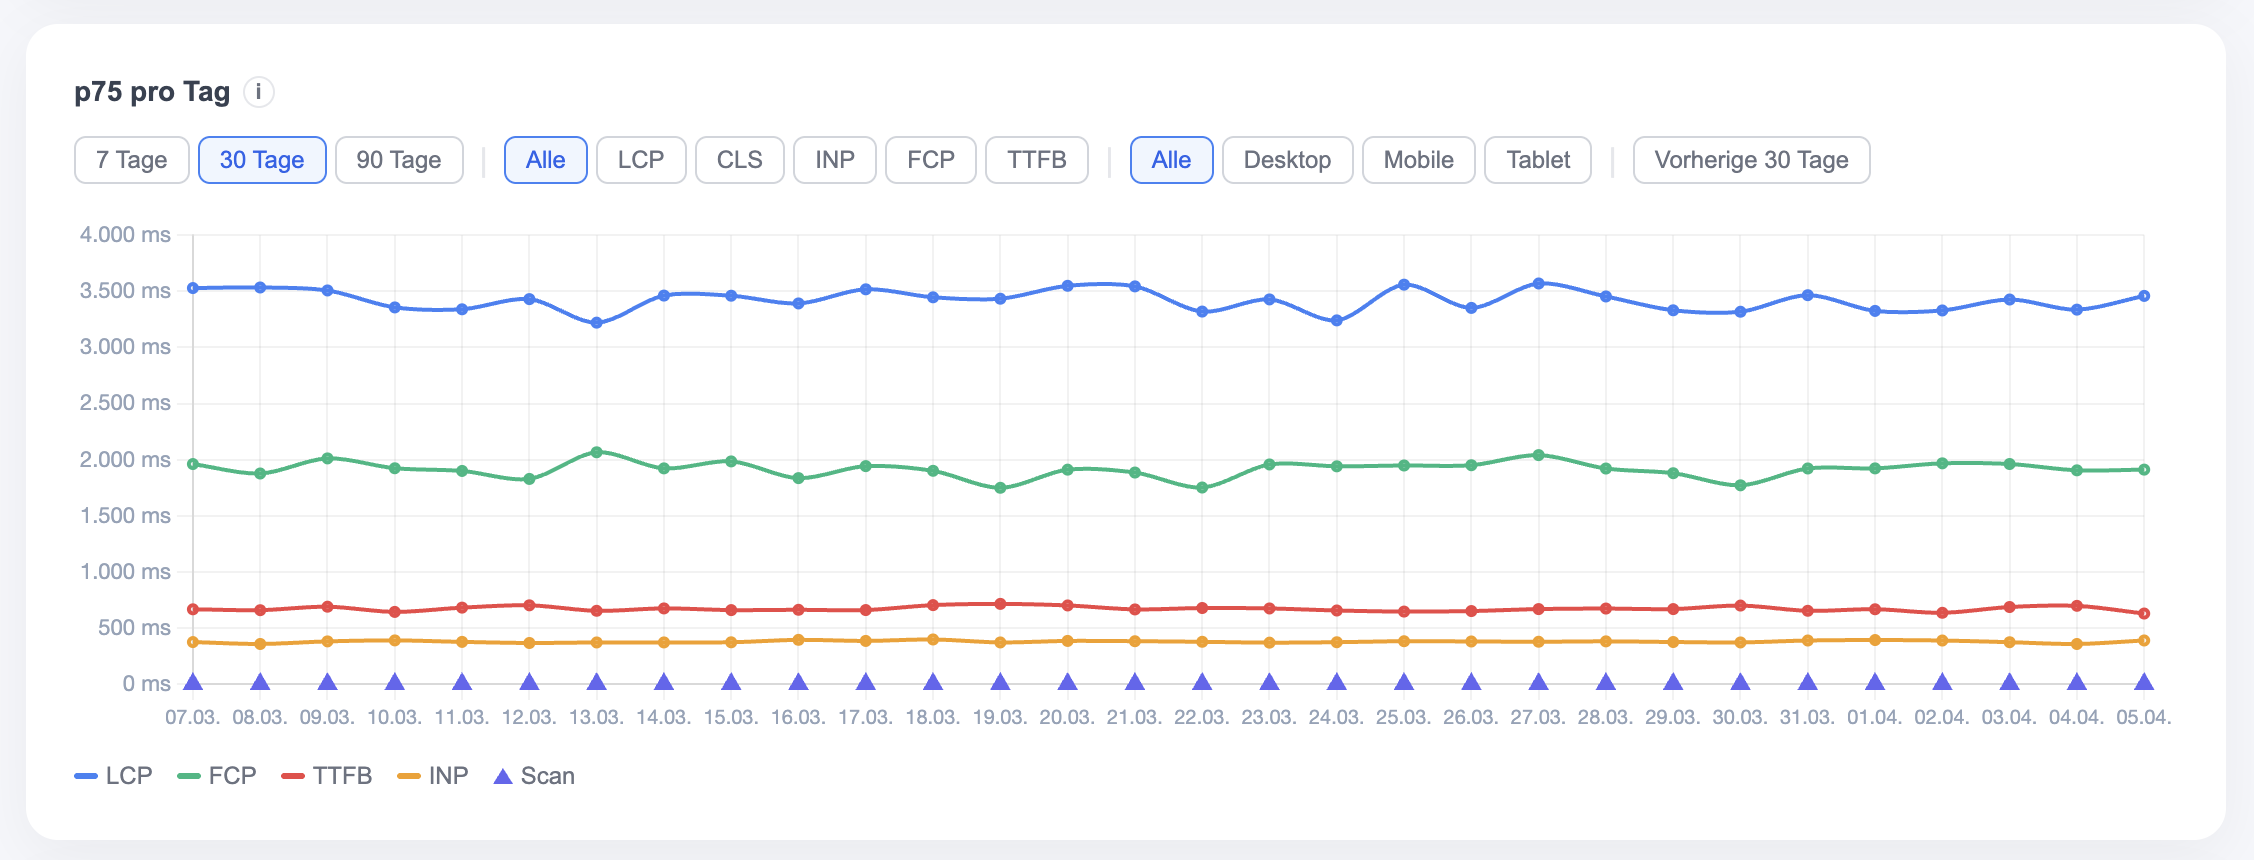
The p75 value (75th percentile) shows the value at which 75 % of your visitors do better and 25 % worse. Google uses p75 for the official Core Web Vitals assessment.
LCP p75: 226 ms
75 % of your visitors have an LCP under 226 ms — excellent.
LCP p75: 3,200 ms
75 % under 3,200 ms — above the Google threshold of 2,500 ms.
Why not the average? Because upward outliers strongly distort the average. p75 shows more realistically how the majority experience your page.
Visible in the product
These metrics are measured
Largest Contentful Paint
Measures when the most important visible content has loaded. Google threshold: under 2,500 ms = good.
Cumulative Layout Shift
Shows whether content jumps around while loading. Google threshold: under 0.1 = good.
Interaction to Next Paint
Measures how quickly your page responds to clicks. Google threshold: under 200 ms = good.
First Contentful Paint
Measures when visible content first appears. Google threshold: under 1,800 ms = good.
Time to First Byte
How quickly does your server respond? Google threshold: under 800 ms = good.
Google's quality signal
Google rates websites based on three signals: LCP, CLS and INP. When all three are in the green range, Google considers the Core Web Vitals passed — an important signal for rankings and user experience.
LCP
CLS
INP
Analysis
What you see in the dashboard
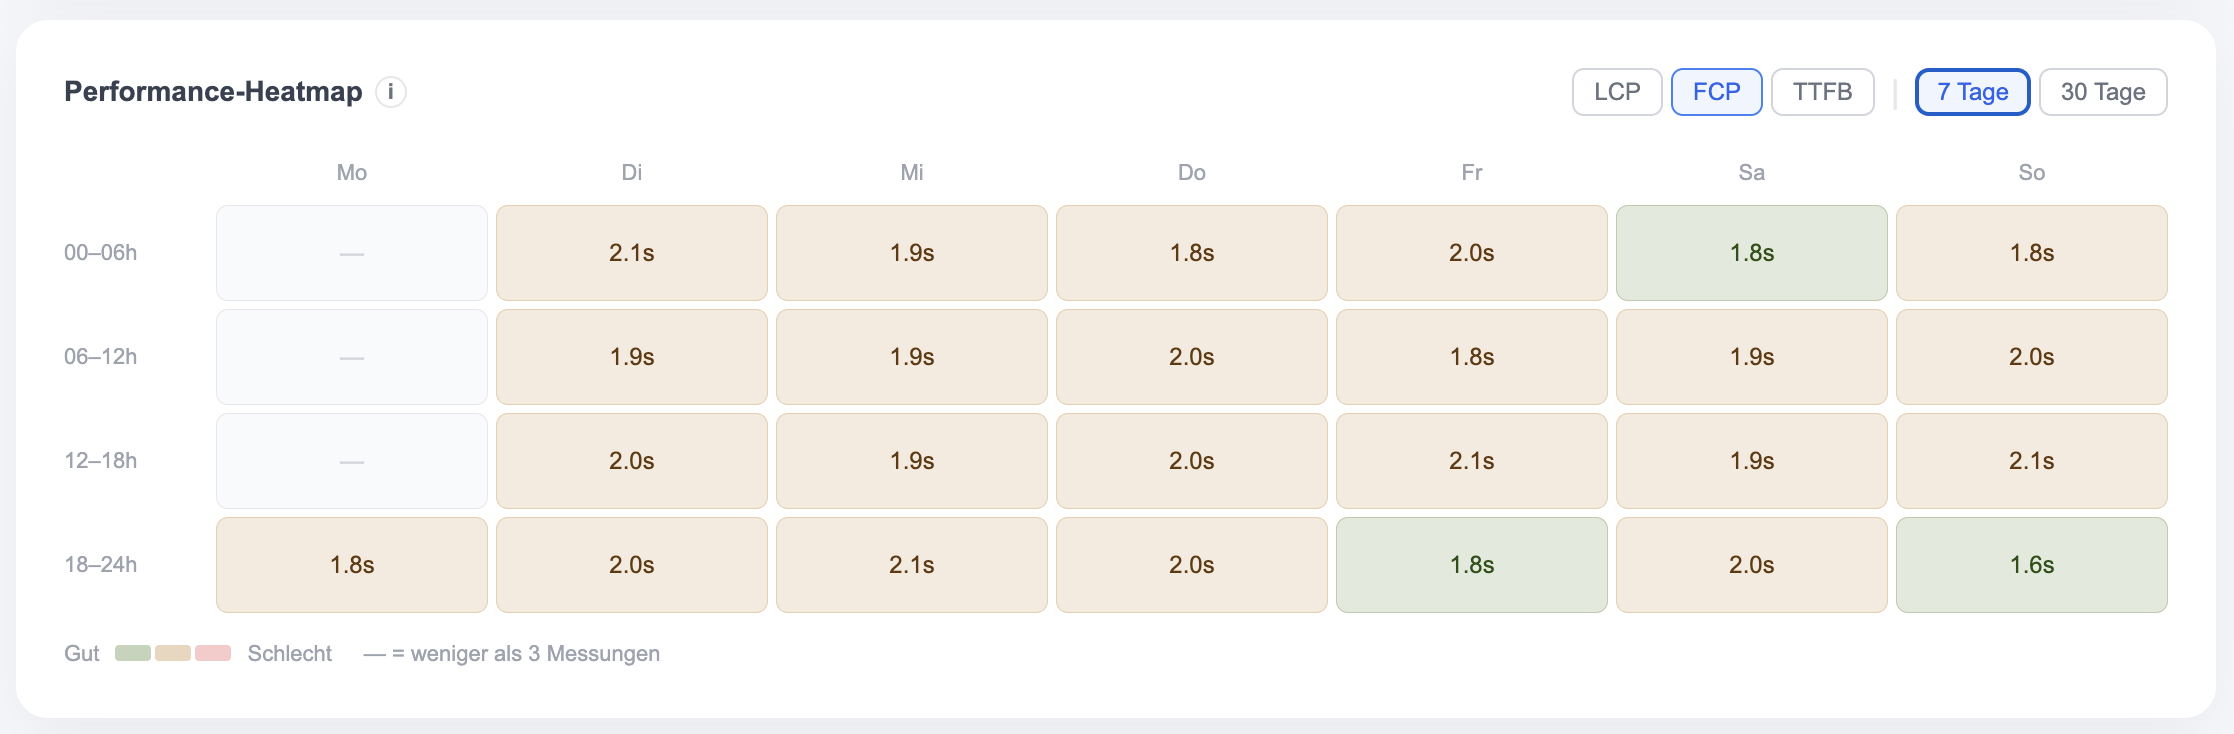
Which days of the week and times of day are slowest? Spot load spikes and recurring patterns.
Which pages are slowest? See p75 LCP, FCP and TTFB per URL — with a history of the last 14 days.
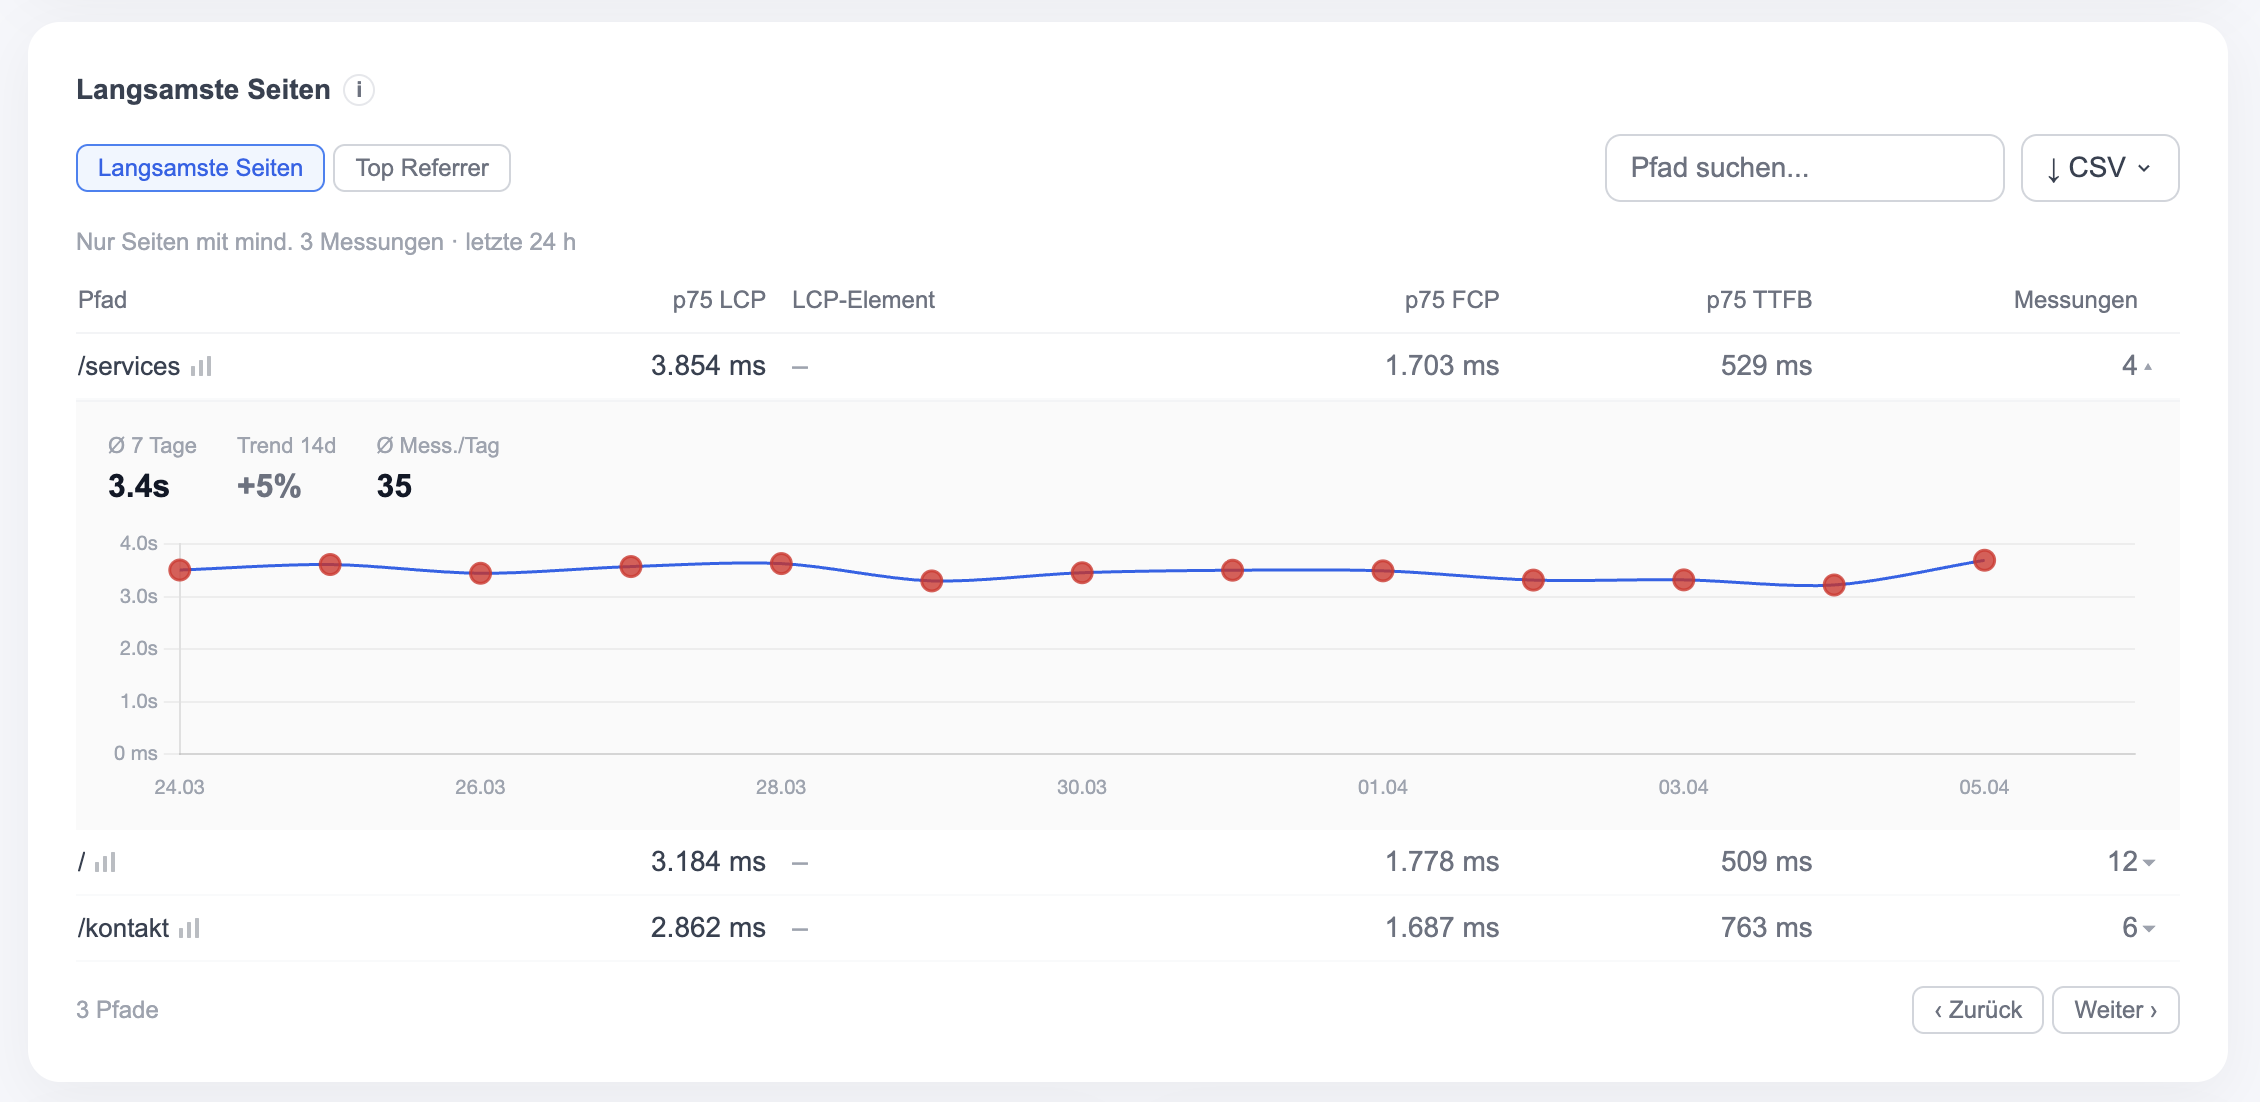
How do mobile users experience your site compared to desktop? How does connection quality affect it?
Get notified automatically when p75 LCP exceeds a threshold — by e-mail or webhook.
Privacy
No cookies
The script sets no cookies and uses no browser fingerprinting.
IP anonymisation
IP addresses are anonymised immediately after country detection and are not stored.
Legal basis
Art. 6(1)(f) GDPR — legitimate interest in technical optimisation. A ready-made privacy policy text block is available in the dashboard.
WordPress
An official turbometrics plugin is available for WordPress. Enter your API key, done — the script is automatically included on all pages.
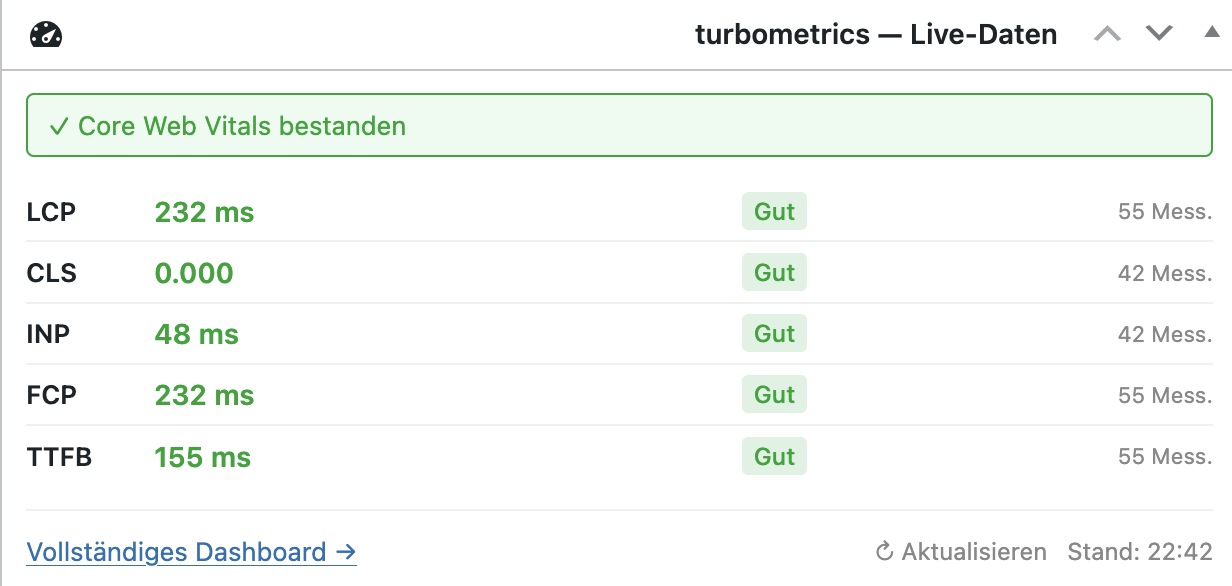
Core Web Vitals right in the WordPress dashboard.
All platforms
Besides WordPress, integration works with Shopify, TYPO3, Next.js, Nuxt, Laravel and any static website. Google Tag Manager is also supported.
Get started now
Live data is available from the Starter plan. Setup takes less than 5 minutes.